Since I now have a shiny new blog, I was curious how the runtime behaviour (loading times etc.) improved. As a first indicator, I use the developer tools included in Webkit (via Google’s Chrome):
| html | style | image | font | total | |
|---|---|---|---|---|---|
| old blog | 439 ms | 317 ms | 430 ms | 210 ms | 1.5 s |
| new blog | 112 ms | 61 ms | 39 ms | 56 ms | 195 ms |
As you can see, the new (static) website performs much better than the old (wordpress-based) one. Both pages were served from my Linux server, over the internet. I am currently sitting at the local university which has a decent internet connection, so it is safe to assume that the internet connectivity does not influence the measurements significantly.
Apache Benchmark
For a real world benchmark, I assume 5 clients to access the site concurrently. Of course this does not reflect a Slashdotting, but I want to see the impact of PHP page creation vs. static pages. Apache provides a nifty tool for running such benchmarks, called ab. The ab command simulates a number of clients and measures the response times of a webserver. By default, ab prints a short statistic summary, but does not output the page load time by request. The parameter “-g” dumps these times in a file:
$ ab -n 1000 -c 5 -g oldblog.txt $URLPlease note that the ab tool does not evaluate the HTML file, so included pictures and CSS files are not loaded. Therefore I measure my webserver, the PHP blog software, and the SQL database in combination. I used the ggplot2 package in GNU R to generate some graphs:
require(ggplot2);
old<-read.table("oldblog.txt", header <- TRUE);
png(filename = "old-hist.png", width = 480,\
height = 400);
qplot(ttime, data=old, geom="histogram",\
binwidth=25) + scale_x_continuous("Load time (ms)")\
+ opts(title="Old Blog");
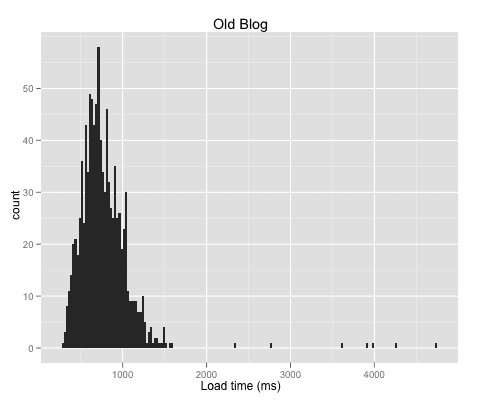
dev.off();My old blog suffers from the PHP page generation. The median of the turnaround times is 724ms, slightly higher than the value measured with just one browser. This is a clear indicator that the webserver is already saturated. Another sign of saturation is the long tail of up to 4.7s.
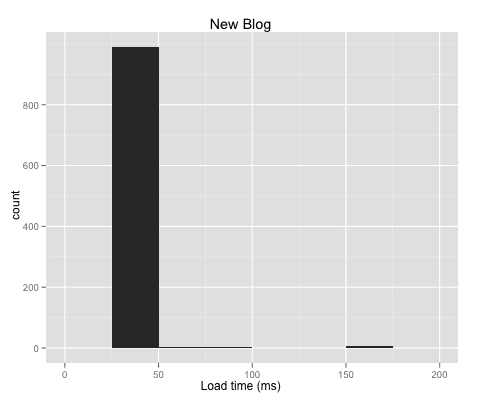
The plot of the new blog looks rather uninteresting. The site is much faster — a single page is delivered in 38ms (median), with a maximum of 163ms. The server does not seem to be saturated by the 5 simulated clients.
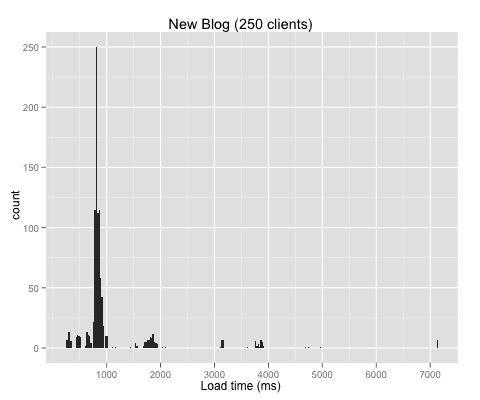
To push my little virtual server to the limits, I increased the number of concurrently simulated clients from 5 to 250. The median of the turnaround time is now 824ms, with a maximum of 7.1s.
In other words: static websites rock, they’re fast and secure. No more wordpress security updates for me.
Related Links
Some links I’ve read during the work on this post: